|
How-to-video |
|
|
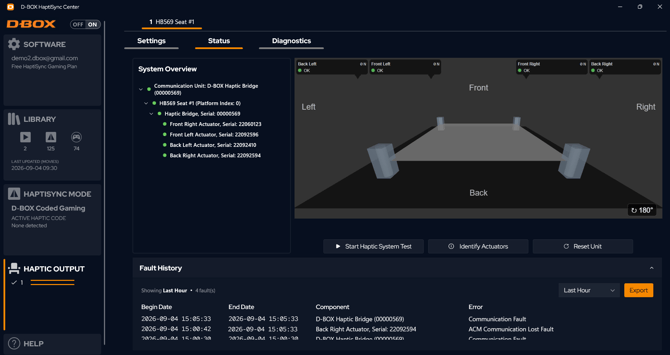
Hardware Fault History information |
When a component fault occurs (actuator, ACM, etc.), the affected component's status turns red and a new entry appears in the Fault History list, with no End Date shown while the fault is still active. Once the issue is resolved, the fault is automatically marked as resolved, an End Date is added to the entry, and the component's status returns to green.
Note: The Fault History panel is collapsed by default. Simply expand it to view the details. An Export option is available directly from the Fault History panel. It always exports the last month of data, for all systems, regardless of what's currently selected or filtered in the view. This same fault history data is also included automatically in the Export Support Logs functionality (see below), so a separate manual export usually isn't necessary. |
|
Replay Mode |
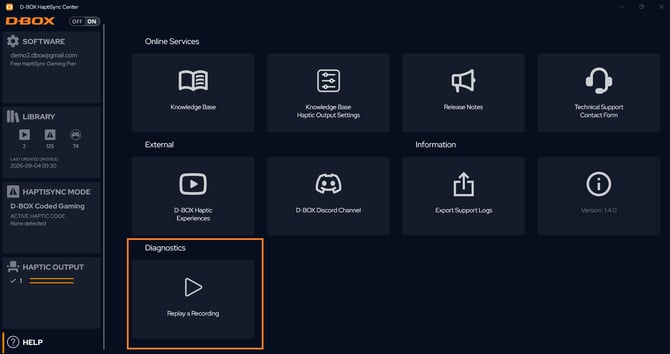
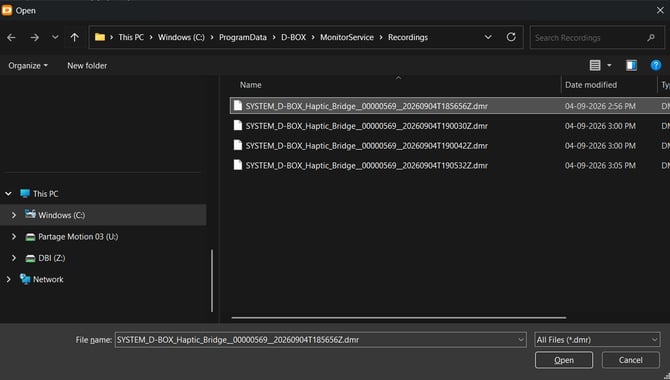
Whenever a fault occurs, HaptiSync Center automatically records all hardware parameters around the event. This data is complex and isn't necessarily meant to be analyzed by users directly; its main purpose is to give D-BOX support, resellers, and partners what they need to troubleshoot the issue. That said, the recording can also be played back directly in HaptiSync Center: this is Replay Mode. To start a replay, go to the Help tab and click the Replay a Recording button/tile. This opens Windows Explorer directly at the folder where recordings are saved. If you are a D-BOX reseller or partner reviewing a recording sent to you by a user, the file won't be in the current folder. You'll need to manually browse to the location where you saved that file before you can select it.
Reading a recording's file name: Each recording is automatically named to identify the affected communication unit, along with the date and time of the fault (in UTC). For example: SYSTEM_D-BOX_Haptic_Bridge__00000569__20260814T193007Z.dmr
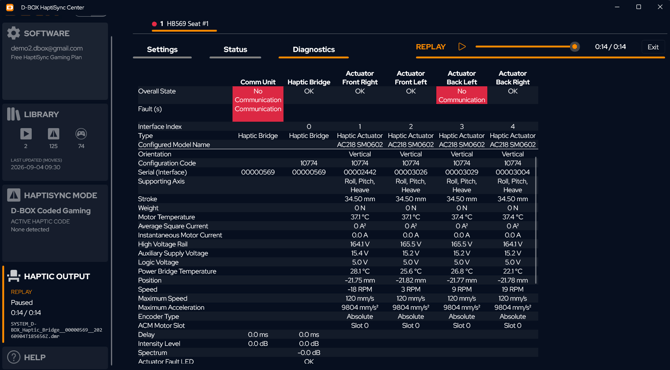
Once a replay is running:
Note: Make sure you're not still in Replay Mode when you think you're looking at live status; check the recording name/indicator in the bottom left to confirm (in the Navigation Pane). You will also see the Navigation/Replay seek bar at the top. |
|
Export Support Logs |
The Export Support Logs functionality available in the Help tab already includes all HaptiSync Center software logs. It now also gathers full diagnostic information, including hardware status and fault information. Here is the information now included in the zipped log file, in addition to the existing software logs:
|
|
These additional files let D-BOX support, resellers and partners diagnose issues without needing you to reproduce them live, and help confirm whether an error originates in the hardware or in the software UI. |
|