Status Tab
Displays the status of each component in your haptic system. All indicators should be green. A red dot signals a faulty component. Use the Diagnostics tab to investigate further.
Additional functions are available via buttons at the bottom right.
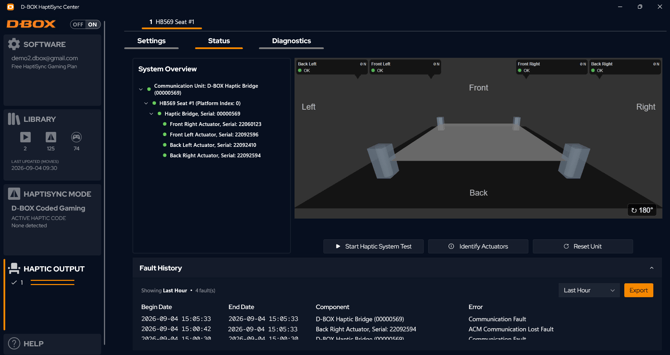
- Start Haptic System: Generates movement and vibration using a preset pattern. Useful for testing hardware-software communication.
- Identify Actuators: Sends a haptic “knock” to each actuator sequentially, with on-screen identification, which helps to verify correct actuator positioning.
- Reset Unit: Resets all actuators to neutral. The platform will perform a homing sequence.
- Fault History: When a component fault occurs (actuator, ACM, etc.), the affected component's status turns red and a new entry appears in the Fault History list, with no End Date shown while the fault is still active. Once the issue is resolved, the fault is automatically marked as resolved, an End Date is added to the entry, and the component's status returns to green.
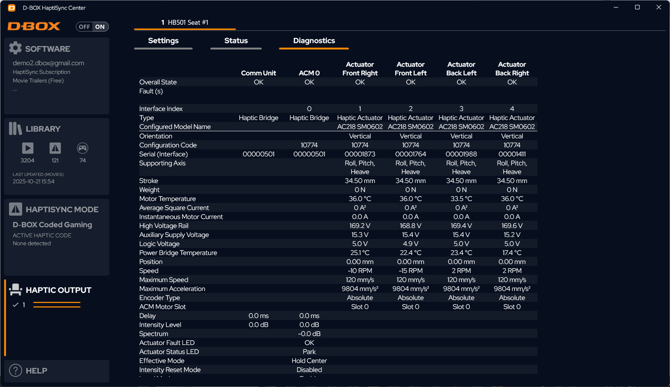
Diagnostics Tab
Displays real-time health status of the haptic system. If a component fails, related information appears in red.
Refer to the System Faults and Alarms section for possible causes and corrective actions.